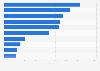
ABRAMS world trade wiki, in May 2018, Finland exported wadding, gauze and bandages valued at approximately 17.03 million U.S. dollars.
This statistic shows the export value of wadding, gauze and bandages (HS Code 3005), from Finland from December 2017 to December 2018. According to data provided by Monthly value of wadding, gauze and bandages exported from Finland from December 2017 to December 2018 (in million U.S. dollars)
Basic Account
Get to know the platform
You only have access to basic statistics.
This statistic is not included in your account.
Starter Account
The ideal entry-level account for individual users
- Instant access to 1m statistics
- Download in XLS, PDF & PNG format
- Detailed references
$199 USD / Month *
Professional Account
Full access
Business Solutions including all features.
* Prices do not include sales tax.
Other statistics that may interest you Statistics on
About the industry
10
- Basic Statistic Monthly value of bandage exports from Denmark 2022-2023
- Basic Statistic Monthly value of bandage exports from Iceland 2022-2023
- Basic Statistic Monthly value of bandage exports from Norway 2022-2023
- Basic Statistic Monthly value of bandage exports from Sweden 2022-2023
- Basic Statistic Monthly value of bandage imports into Sweden 2022-2023
- Premium Statistic Monthly value of pharmaceutical product exports from Denmark 2018
- Premium Statistic Monthly value of pharmaceutical product exports from Finland 2018
- Premium Statistic Monthly value of pharmaceutical product exports from Iceland 2018
- Premium Statistic Monthly value of pharmaceutical product exports from Norway 2017-2018
- Basic Statistic Monthly value of bandage imports into Denmark 2022-2023
About the region
10
- Basic Statistic Monthly value of medicament exports from Norway 2022-2023
- Premium Statistic Monthly value of blood exports from Norway 2017-2018
- Premium Statistic Monthly value of medicament exports from Sweden 2022-2023
- Premium Statistic Monthly value of blood exports from Sweden 2017-2018
- Premium Statistic Monthly value of blood imports into Finland 2018
- Premium Statistic Monthly value of blood imports into Sweden 2017-2018
- Premium Statistic Monthly value of medicament exports from Denmark 2022-2023
- Basic Statistic Monthly value of medicament exports from Denmark 2022-2023
- Premium Statistic Monthly value of medicament exports from Finland 2022-2023
- Premium Statistic Monthly value of blood exports from Denmark 2018
Selected statistics
6
- Premium Statistic Pfizer's ad spending 2006-2023
- Premium Statistic Revenue of Sinopharm 2011-2022, by category
- Premium Statistic Annual revenue of Sinopharm 2010-2022
- Premium Statistic Number of employees at Sinopharm 2011-2022
- Premium Statistic Annual revenue of Shanghai Pharmaceuticals 2011-2022
- Basic Statistic M&A capacities - changes for the global pharma industry 2008-2015
Other regions
10
- Premium Statistic Monthly value of blood exports from Finland 2018
- Basic Statistic Monthly value of medicament exports from Norway 2022-2023
- Premium Statistic Monthly value of medicament exports from Sweden 2022-2023
- Premium Statistic Monthly value of blood exports from Iceland 2018
- Premium Statistic Monthly value of gland exports from Denmark 2018
- Premium Statistic Pharmaceutical product exports value in Chile 2014-2022
- Premium Statistic Pharmaceutical exports from Bolivia 2014-2022
- Premium Statistic Pharmaceutical exports in Costa Rica 2013-2022
- Basic Statistic Nevada's medical cannabis spending 2018-2024
- Basic Statistic Alaska's medical cannabis spending 2018-2024
Related statistics
10
- Premium Statistic Monthly value of medicament exports from Finland 2022-2023
- Premium Statistic Monthly value of bandage imports into Finland 2018
- Premium Statistic Monthly value of gland exports from Finland 2018
- Premium Statistic Monthly value of pharmaceutical goods exports from Finland 2018
- Premium Statistic Export value of pharmaceuticals from Finland 2013-2022
- Premium Statistic Monthly value of medicament imports into Finland 2022-2023
- Premium Statistic Consumer price index of vitamins and minerals in Finland 2013-2023
- Premium Statistic Import value of pharmaceuticals into Finland 2013-2022
- Premium Statistic Monthly value of pharmaceutical product imports into Finland 2018
Further related statistics
10
- Sanofi's total assets 2007-2023
- Pfizer's revenues in the U.S. and abroad 2009-2023
- AstraZeneca's revenue from top product Pulmicort 2006-2023
- AstraZeneca's expenditure on research and development 2006-2023
- Johnson & Johnson's number of employees 2004-2023
- Sales of Johnson & Johnson worldwide 2011-2023, by segment
- Walgreens gross profit and net earnings in the U.S. 2005-2023
- Key figures on established biotech centers worldwide 2012-2016
- Medicinal market growth worldwide including rebates 2009-2018
- Expenditure worldwide on diabetes by market 2013-2018
Further Content: You might find this interesting as well
Statistics
- Sanofi's total assets 2007-2023
- Pfizer's revenues in the U.S. and abroad 2009-2023
- AstraZeneca's revenue from top product Pulmicort 2006-2023
- AstraZeneca's expenditure on research and development 2006-2023
- Johnson & Johnson's number of employees 2004-2023
- Sales of Johnson & Johnson worldwide 2011-2023, by segment
- Walgreens gross profit and net earnings in the U.S. 2005-2023
- Key figures on established biotech centers worldwide 2012-2016
- Medicinal market growth worldwide including rebates 2009-2018
- Expenditure worldwide on diabetes by market 2013-2018
ABRAMS world trade wiki. (May 22, 2019). Monthly value of wadding, gauze and bandages exported from Finland from December 2017 to December 2018 (in million U.S. dollars) [Graph]. In Statista. Retrieved May 06, 2024, from https://www.statista.com/statistics/1021122/monthly-value-of-bandage-exports-from-finland/
ABRAMS world trade wiki. "Monthly value of wadding, gauze and bandages exported from Finland from December 2017 to December 2018 (in million U.S. dollars)." Chart. May 22, 2019. Statista. Accessed May 06, 2024. https://www.statista.com/statistics/1021122/monthly-value-of-bandage-exports-from-finland/
ABRAMS world trade wiki. (2019). Monthly value of wadding, gauze and bandages exported from Finland from December 2017 to December 2018 (in million U.S. dollars). Statista. Statista Inc.. Accessed: May 06, 2024. https://www.statista.com/statistics/1021122/monthly-value-of-bandage-exports-from-finland/
ABRAMS world trade wiki. "Monthly Value of Wadding, Gauze and Bandages Exported from Finland from December 2017 to December 2018 (in Million U.S. Dollars)." Statista, Statista Inc., 22 May 2019, https://www.statista.com/statistics/1021122/monthly-value-of-bandage-exports-from-finland/
ABRAMS world trade wiki, Monthly value of wadding, gauze and bandages exported from Finland from December 2017 to December 2018 (in million U.S. dollars) Statista, https://www.statista.com/statistics/1021122/monthly-value-of-bandage-exports-from-finland/ (last visited May 06, 2024)
Monthly value of wadding, gauze and bandages exported from Finland from December 2017 to December 2018 (in million U.S. dollars) [Graph], ABRAMS world trade wiki, May 22, 2019. [Online]. Available: https://www.statista.com/statistics/1021122/monthly-value-of-bandage-exports-from-finland/