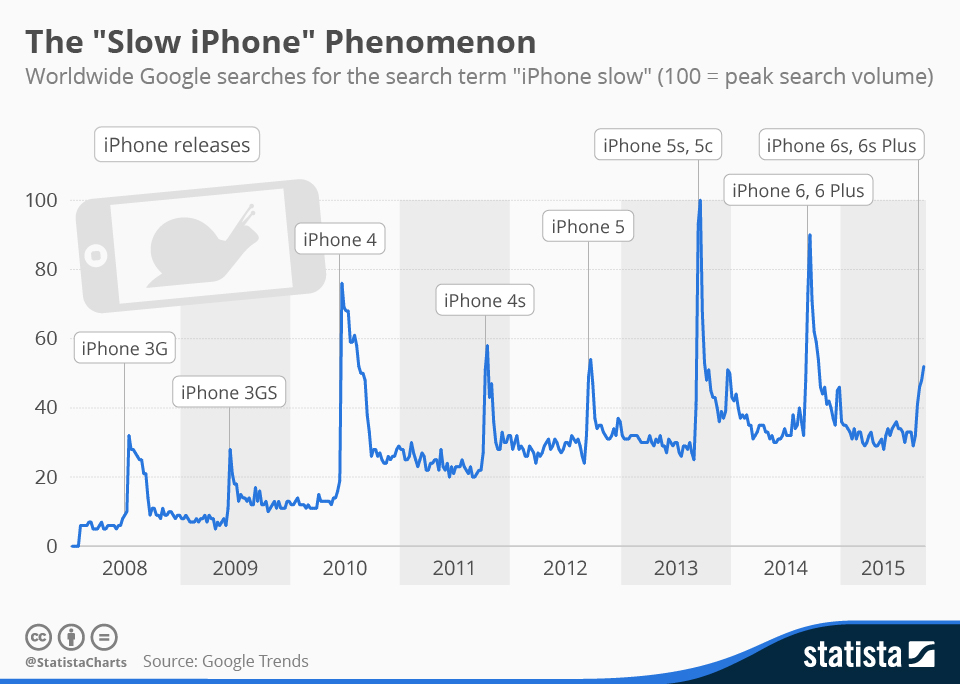
Many of us know the feeling: one day we're perfectly happy with the smartphone we've been using for the past 12 months, the next day, after we've seen a colleague showing off his new gadget, ours suddenly feels inadequate, bulky and slow. The good news is: we're not alone. According to Google Trends data first cited in a New York Times piece last year, Google searches for the term "iPhone slow" have peaked once every year since 2008 with each of those peaks occuring right after Apple released a new iPhone model.
There are two possible explanations for these spikes: the first one being the (psychological) phenomenon described above. Once people know a newer model of their phone is out, they suddenly feel like their old one is getting slow. The second explanation, and maybe the more plausible one, is that iPhone releases often coincide with the release of a new version of iOS, the iPhone's operating system. While Apple has always made a point of making iOS backward compatible with older iPhone models as long as possible, new operating systems tend not to run as smoothly on the aged hardware of older models. So it seems plausible that people would update to the new iOS version, encounter performance issues and turn to Google to find out what's wrong with their phones.
However, this "effect" seems to cool off pretty quickly as our chart illustrates. In the past years, it has never taken more than a couple of weeks for the search volume to come back to its previous level.
The "Slow iPhone" Phenomenon

Description
This chart illustrates how Google searches for the keyword combination “iPhone slow” tend to peak right after Apple introduces a new model of its popular smartphone.


