There was a time, around 20 years ago, when Microsoft had around 90 percent market share in the computing market while other companies, most notably Apple, were fighting for relevance. A lot has changed since then. It began with the slow reemergence of Apple in the late 1990s and early 2000s, but it wasn't until the first iPhone was released in 2007 that the market was turned upside down. Within a couple of years, hundreds of millions of new computing devices were sold and Microsoft lost its dominant market position.
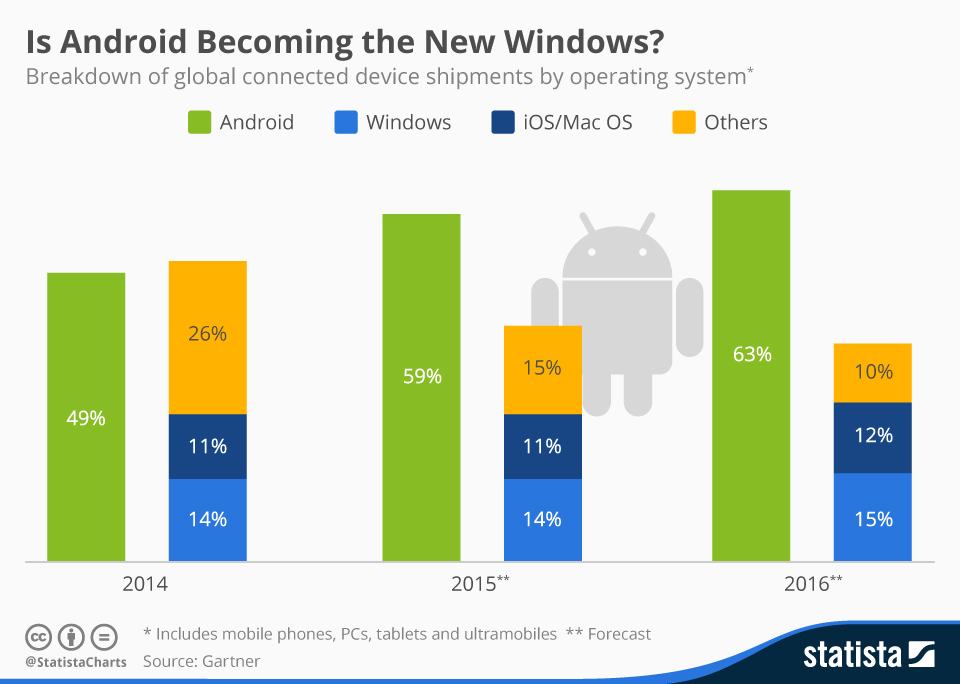
Now it’s Windows that’s struggling to stay relevant while another operating system is as ubiquitous as Windows once was. It’s not Apple that has risen to dominance though - Mac OS and iOS still trail Windows in terms of market share. It’s Android that has taken over the reins from Microsoft. According to Gartner's latest forecast, Google's open operating system will be installed on almost 60 percent of all connected devices shipped this year. That includes PCs, mobile phones, tablets and so-called hypermobiles, a relatively new category of devices that consists of tablet/PC hybrids and cloud-based laptops such as Google's Chromebook. In 2014, more than one billion Android devices were shipped worldwide, likely bringing Android's installed base to more than two billion devices.
Is Android Becoming the New Windows?

Description
This chart breaks down global shipments of connected devices, i.e. PCs, mobile phones, tablets and hypermobiles, by operating system.


